

Group dashboard
Which widgets the group dashboard shows: result and turnover per month and rolling 12 months, a top list of customers, payments to the Swedish Tax Agency, salary payment status and depleted equity.
The group dashboard is part of the group module, where you get insights and important actions for all your companies in one place. You get access to key figures such as rolling 12 months for turnover and result in the group, and also the group’s top 10 largest customers. In addition to figures and insights about the group, we also highlight the most important action points in day-to-day work, such as payments to the Swedish Tax Agency, salary payments and an indication of whether the equity in the companies is starting to become depleted.
Result per month
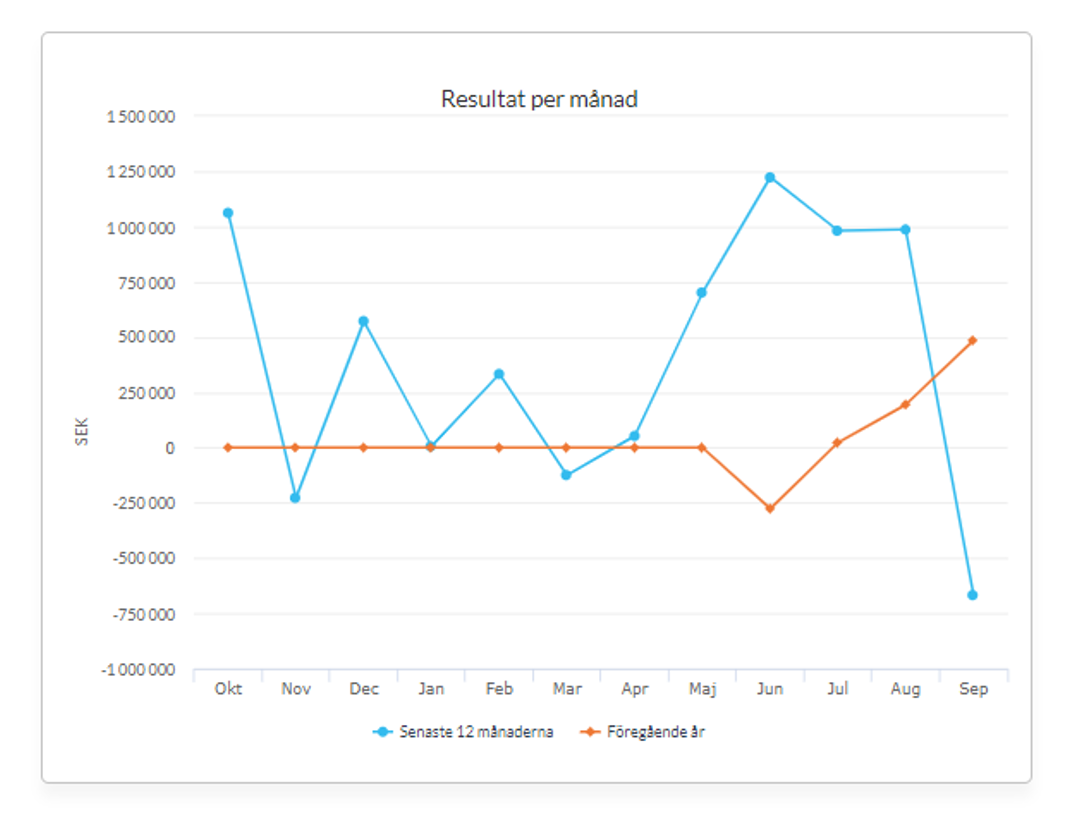
The graph shows the group’s result per month, twelve months back in time.
The purpose of the graph is to visualise change, trends and deviations in the group’s result per month.
We retrieve the group’s result including eliminations, for each month, for the last 12 months.
The orange line refers to the last 12 months and the dark line refers to the period before (months 13 to 24 back in time).
Turnover per month
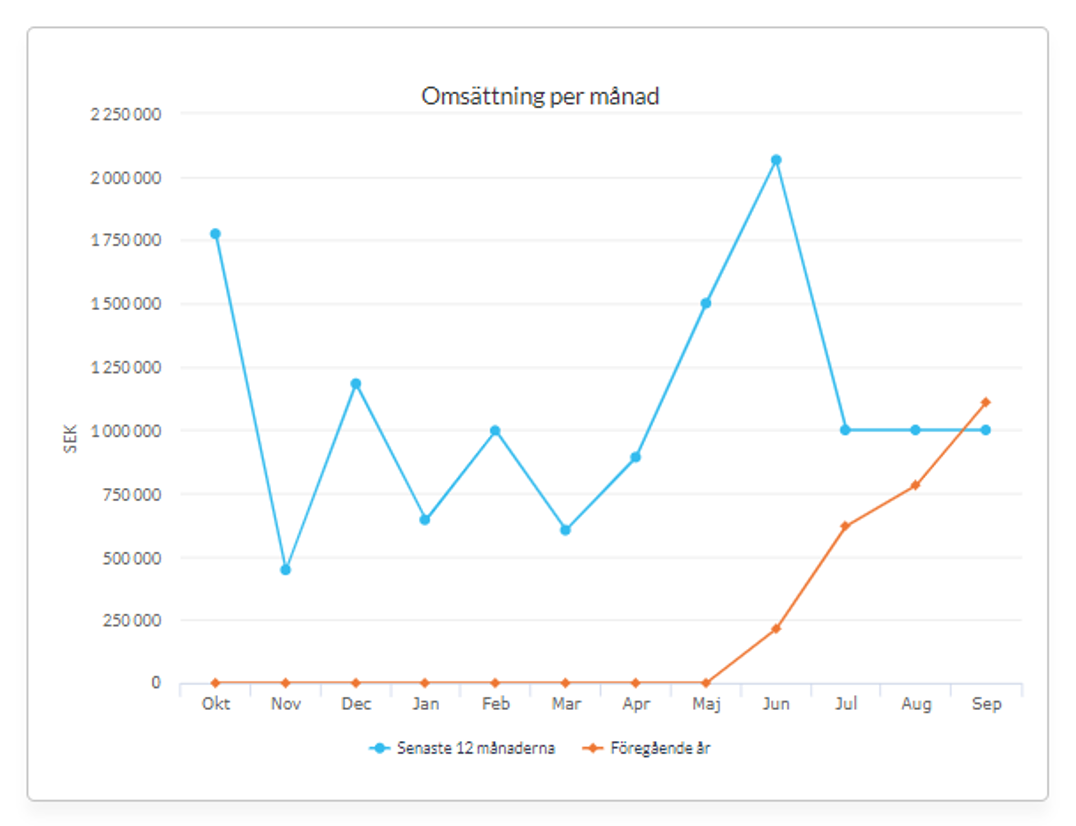
The graph shows the group’s turnover per month, twelve months back in time.
The purpose of the graph is to visualise change, trends and deviations in turnover per month.
We retrieve the group’s turnover including eliminations for each month, for the last 12 months.
The orange line refers to the last 12 months and the dark line refers to the period before (months 13 to 24 back in time).
Result rolling 12
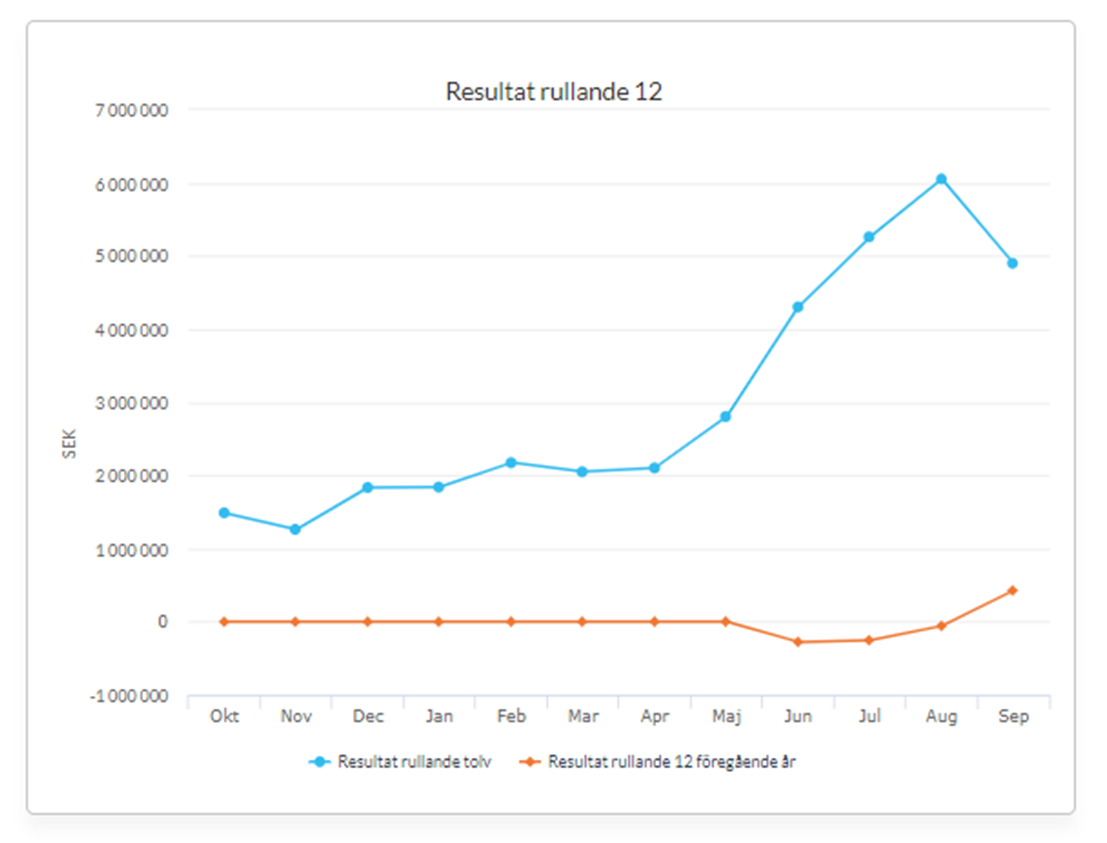
The graph shows the group’s result. For each month in the graph, the result for the last 12 months up to the month in the graph is shown. Hence the name rolling 12.
This key figure is a good management tool that makes the figures comparable regardless of financial year and deviations for specific periods and so on.
We retrieve the group’s accumulated result for the last 12 months, for each month in the graph.
The orange line refers to the last 12 months and the dark line refers to the period before (months 13 to 24 back in time).
Turnover rolling 12
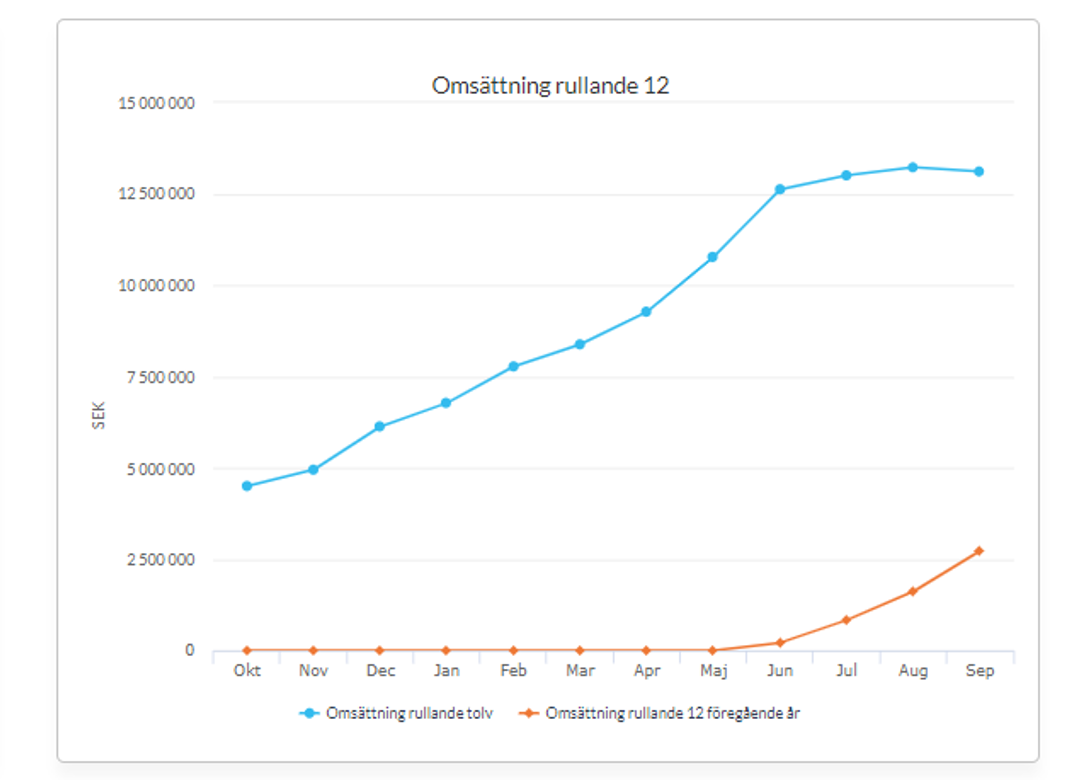
The graph shows the group’s turnover. For each month in the graph, the turnover for the last 12 months up to the month in the graph is shown. Hence the name rolling 12.
This key figure is a good management tool that makes the figures comparable regardless of financial year and period deviations.
We retrieve the group’s turnover on all accounts that are included in the standard chart of accounts’ definition of turnover, including eliminations. We then retrieve the accumulated turnover, 12 months back for each month in the graph.
The orange line refers to the last 12 months and the dark line refers to the period before (months 13 to 24 back in time).
Top list of customers (turnover)
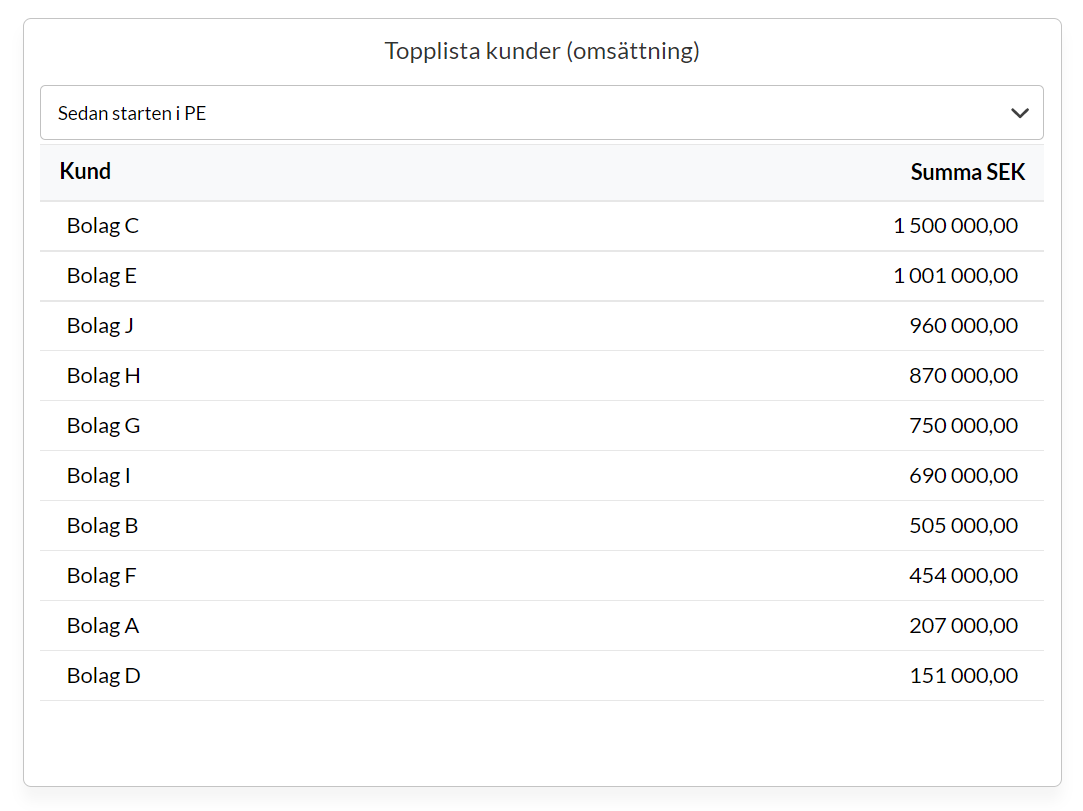
The graph shows the group’s top 10 customers based on the organisation number of the end customer that the revenue is linked to. This means we do not look at the “middleman” if the invoicing goes through a broker.
The purpose is to show the largest customers you work with in the group.
We group the customers by revenue that we can link to one and the same organisation number in each group company. The total is shown in SEK and excludes VAT.
You can choose the time period in the filter above the table: Past 12 months, Current fiscal year or All time.
Payments to the Swedish Tax Agency
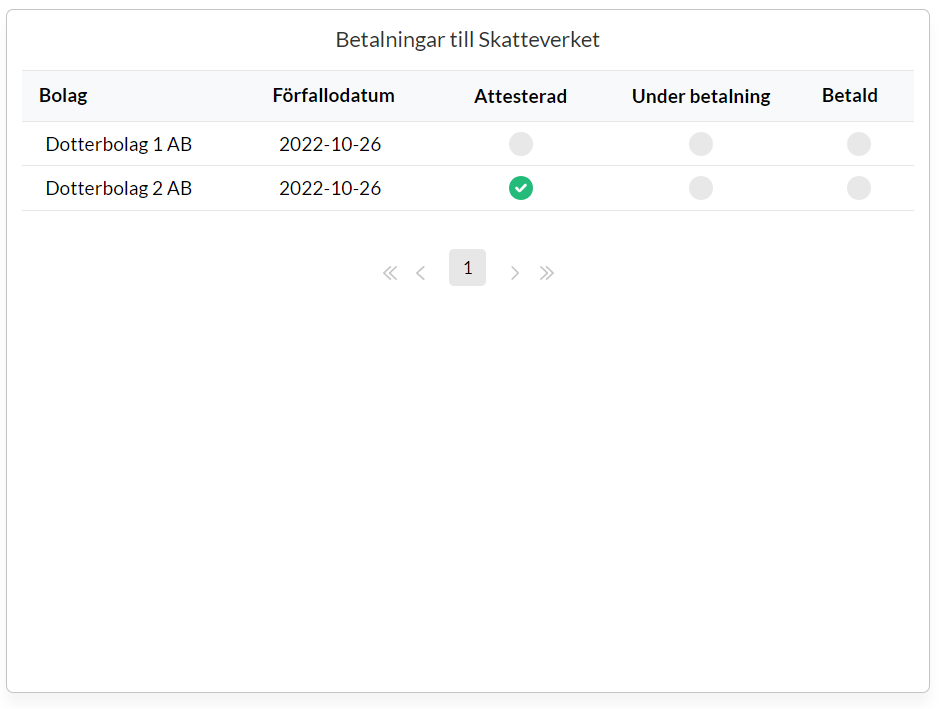
The graph shows the status of payments to the Swedish Tax Agency. All payments that the companies have outstanding to the Swedish Tax Agency are shown, together with checkboxes showing whether the basis for the payment has been authorised in Kleer, whether the payment has been sent via the system and whether the invoice in Kleer is marked as paid.
The purpose is to give good insight into the payments to the Swedish Tax Agency. A missed payment to the Swedish Tax Agency can lead to interest expense on the tax account. Getting interest expense on the tax account twice a year can mean a qualified audit report.
We retrieve all “invoices” in Kleer that are addressed to the Swedish Tax Agency’s bankgiro number. If the invoice is authorised and paid and the due date has passed by more than 5 days, the invoice is removed from the widget. The payments are sorted by due date, with the shortest due date at the top of the list.
Salary payment status
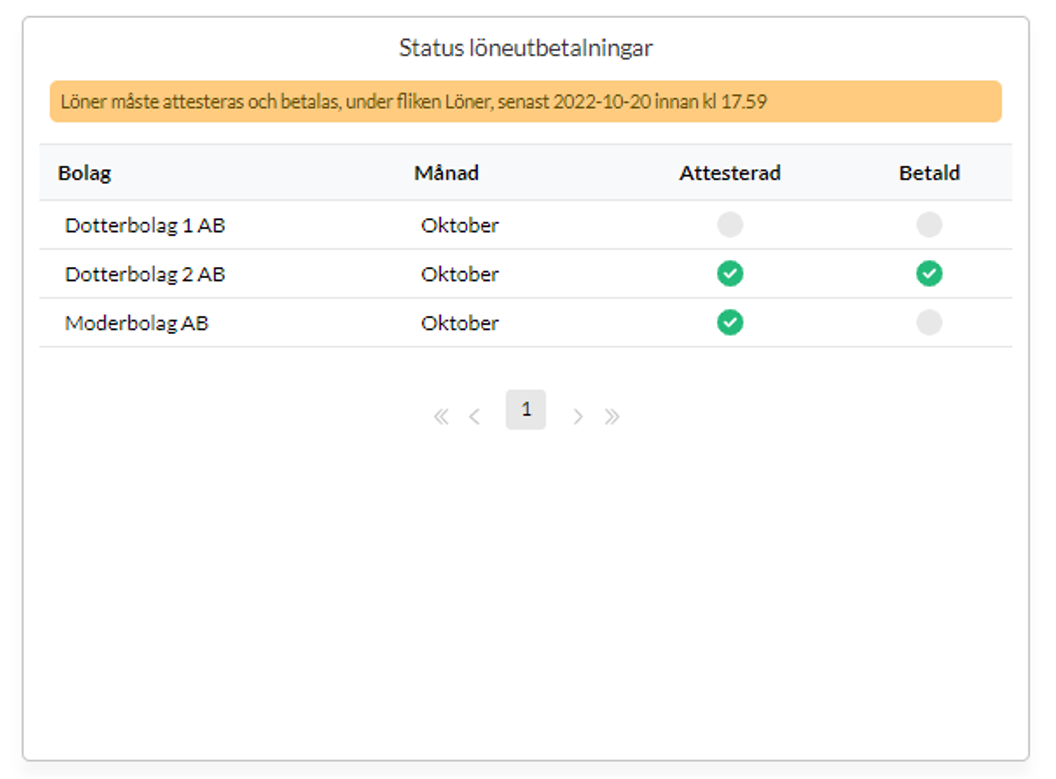
The graph shows whether there are any salaries left to authorise and pay, and what the last date is for the salaries to be paid out on time.
We check whether any salary is left under “Authorise”. If so, the widget will not have a green status for authorisation and payment. If all salaries are authorised, the Authorised column gets a green tick.
The salaries are paid, and green, once the payment has been initiated from Kleer.
Indication of depleted equity
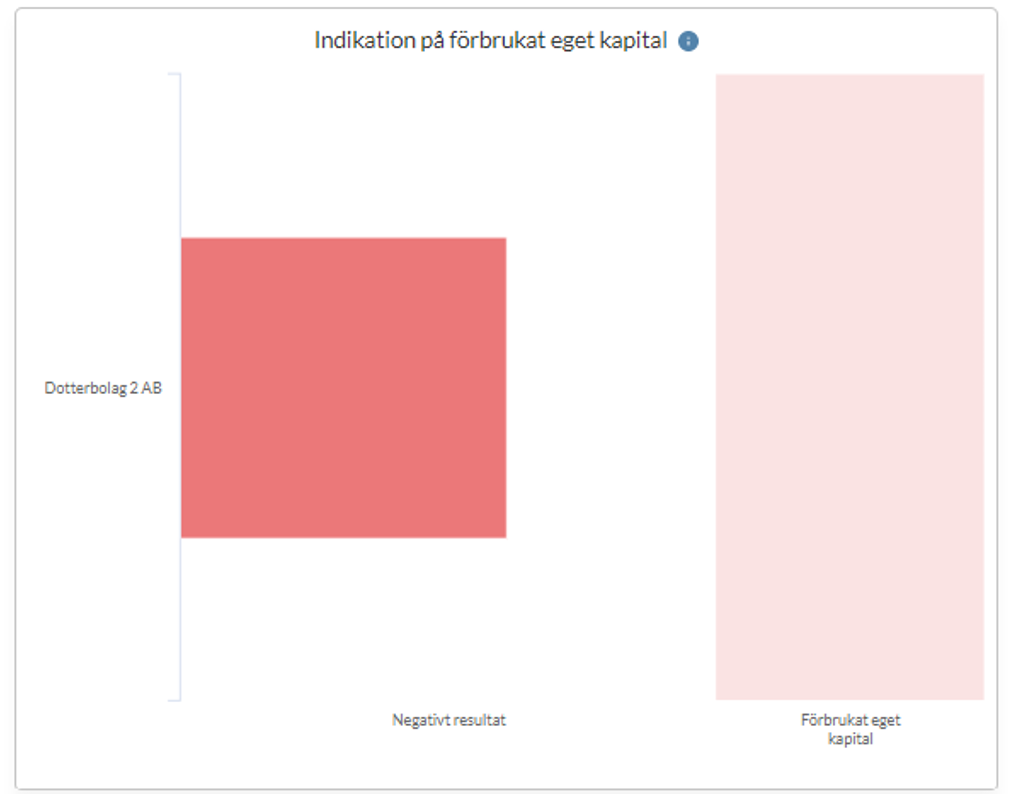
The graph shows companies with a negative result. Companies with a positive result are not shown in the graph. The size of the bar depends on the share of negative result compared to the room available to deplete.
Depleted equity means certain measures, such as a control balance sheet and a plan to get the business back on its feet, a shareholder contribution or similar. If the control balance sheet is not done, the board can become liable for payment.
Our consultants check this every month, but we want to give you good insight into it on an ongoing basis, for more control and security.
We retrieve the companies’ results up to and including the latest month that has passed. If it is negative, it is shown in the graph. How much the companies can deplete is calculated according to established practice (Total equity, half of the share capital + untaxed reserves * (1 - corporate tax). The equity is depleted when it falls below half of the share capital. With the calculation above you can get an indication before you start eating into the share capital.
Open/lock for bookkeeping
The graph shows which months are open or locked for bookkeeping in each company in the group. There is one bar per company, divided into the months of the accounting year you have selected.
The purpose is to let you quickly see which companies have closed their months and which are still open.
Each month has the colour of the lock in force:
- Green: open for all bookkeeping.
- Yellow: locked for all bookkeeping except A (manual vouchers).
- Orange: locked for all bookkeeping except F (accruals).
- Red: locked for all bookkeeping by the financial manager.
- Black: locked for all bookkeeping by a Kleer consultant.
- Grey: the month is outside the company’s accounting year.
A striped month has more than one type of lock. Hold the pointer over the month to see which. To change a lock, go into the company.
Balances at the bank
The table lists the companies in the group with the total balance of each company’s bank accounts. The balance is the booked balance in the current accounting year up to today, on the ledger account (19XX) the bank account is linked to. Only active bank accounts linked to an account in the range 1900 to 1999 are included. Amounts are shown in the group’s currency.
Click the arrow next to a company to see the account number, account name and balance of each bank account. Companies are sorted by name.
FAQ
Can we create our own widgets in the dashboard?
No, the dashboard consists of a number of standard widgets.
Is the dashboard included in the group module?
Yes, the dashboard is included in the group offering.