

The absence overview
A clear overview of absence statistics where you can filter the information by absence type, office, employment type and other relevant factors.
Get an overview of and insights into employee absence
Information
All reported absence is included in the overview, which means that both historical and future planned absence is made visible. This gives a complete picture of absence patterns and makes proactive planning possible.
Drill-down structure
The report is built with an overall view at year level, where you can filter further down to quarter and month level. You can also select specific categories, for example absence type, office or employment type, for a more targeted analysis depending on which categories are used in the company.
The charts are interactive, which makes it possible to click further into the data to get a deeper understanding within a selected area, for example a specific workplace or absence type.
Selectable periods for the absence overview
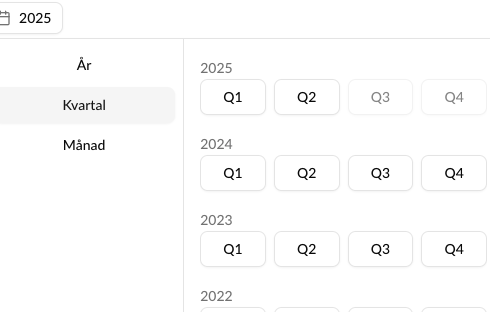
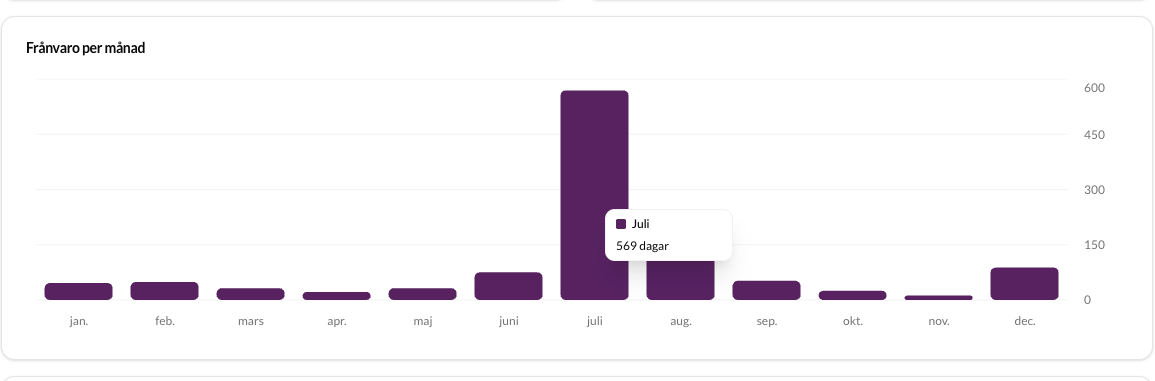
You can choose to analyse a specific period by filtering on year, quarter or month, depending on the level of detail you want.
You can also interact directly with the visualisations. If you hover over a bar in the chart, relevant information is shown, and if you click a specific period (for example a month), you automatically get a deeper view for that period.
This drill-down function gives quick access to detailed data without having to navigate away from the overall report.
Permissions, who can see the dashboard?
Access is set per dashboard and per role, not once for the whole of Insights. A role can therefore have access to one overview without having access to another. If the role has no access, the dashboard is not shown at all.
Two scopes can be given:
- All. The role sees all the data in the overview.
- Subordinates. The role sees its own reporting chain downwards. This applies not only to those who report directly, but to all levels below.
You control this under Settings > Dashboard permissions. How to do it is described in Dashboard permissions.
Categories and filtering
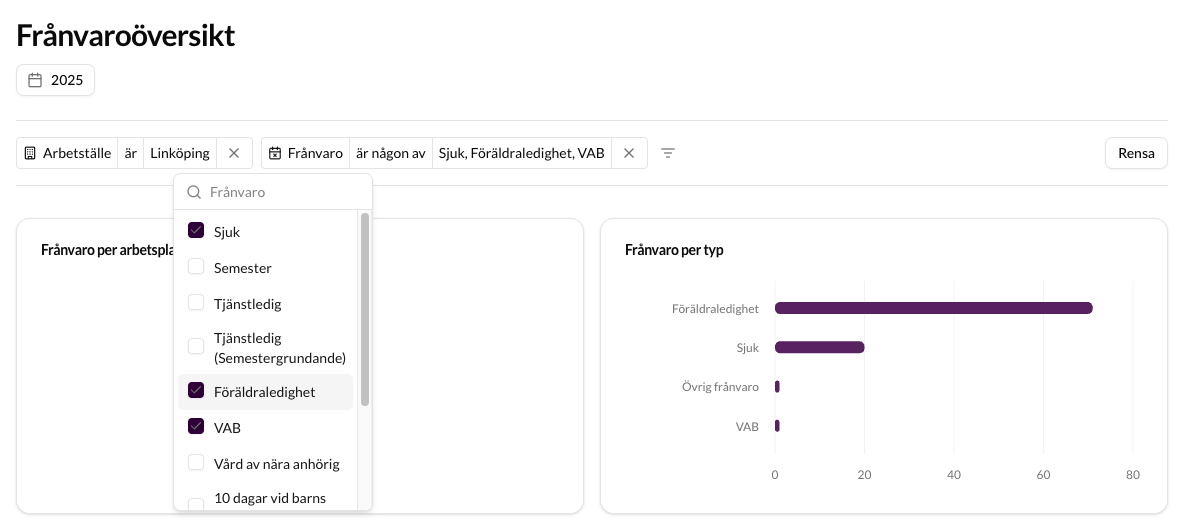
Categories contain the categories that have been set up at the company, but information from time reports and salary settings is also included in the dashboard, such as absence types and workplace. In this way you can get a very good overview of absence for the company’s employees.
Absence categories as filter options can also be filtered out by clicking the graphs to bring up the underlying data.
Filtering logic:
- If no choice is made, everything in the category ALL (All) is selected automatically
- Within a multi-select: OR (is any of)
- Between multi-selects: AND (is)
Limitations
- Historical changes to categories are not saved. Only the most recently registered setting is available. This means that changes in position, office or other categories cannot be traced back in time if they have changed over time.
-
Graphs and visualisation
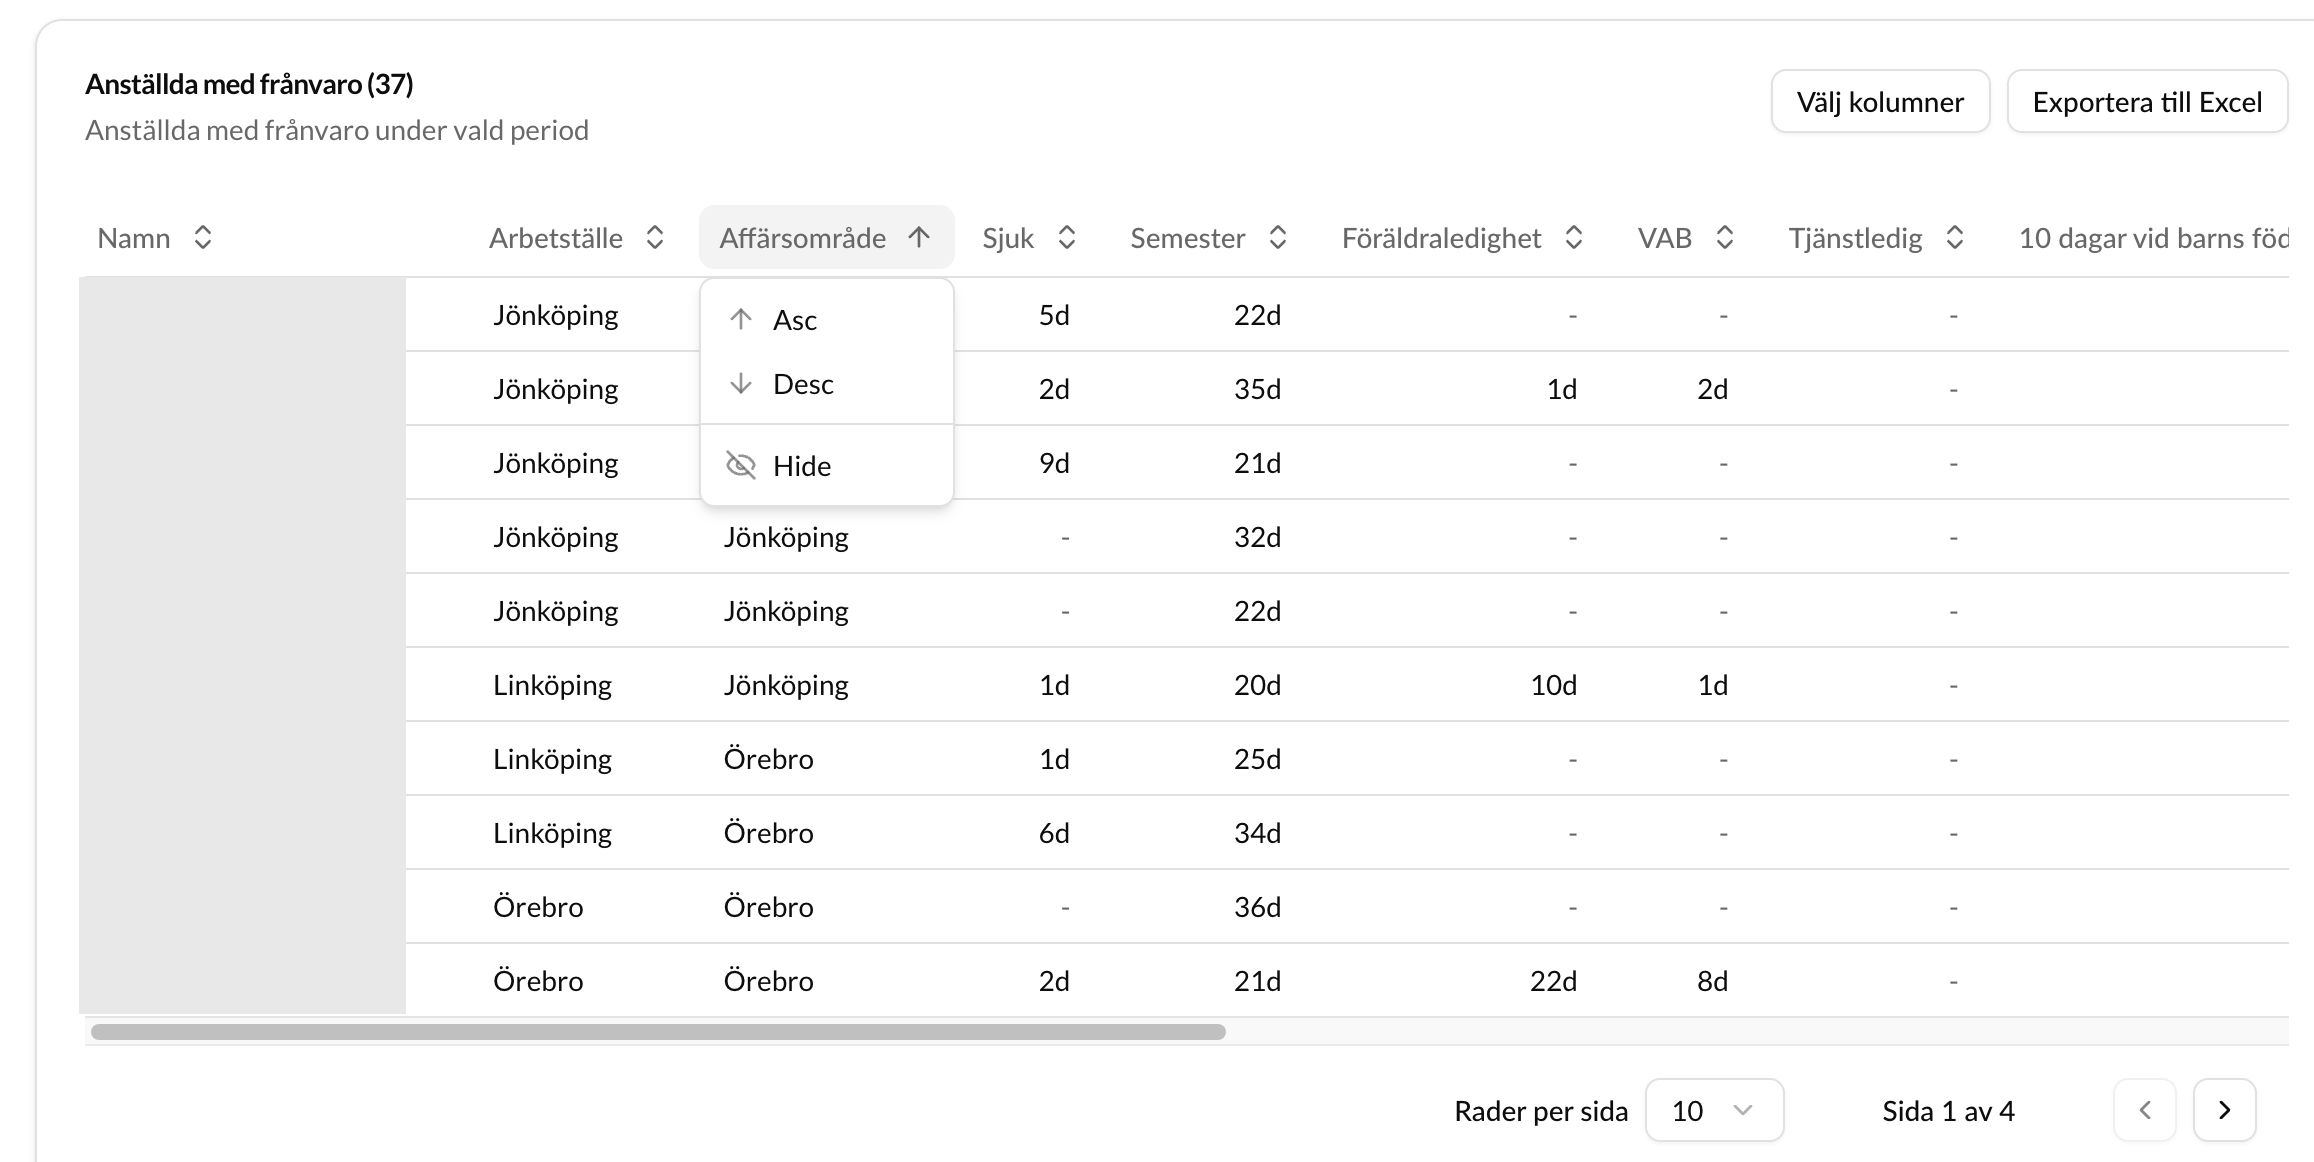
Graphs are interactive. Click a category and the filtering and the underlying report are updated
Visualisation:
- Pie chart: Absence per workplace Shows the distribution of absence between different workplaces. By clicking a segment in the pie chart you can filter out the data for the selected workplace.
- Horizontal bar chart: Type of absence Shows the distribution between different absence types (for example sickness, vacation, care of sick child). Click a bar to filter out the data for that absence type.
- Vertical bar chart: Total absence per month Visualises the development of total absence over time. By clicking a month in the bar chart you can select a specific month for further analysis.
- Table: Underlying data The table view shows detailed data and can be adapted to your needs:
- Sorting in ascending or descending order per column
- Ability to hide/show specific columns
- Export function to Excel for further processing.
FAQ
Why is workplace a combination of digits for one or more employees?
These special workplace numbers are added by the system and cannot be changed:
- 99990: People who have received cash pay or other financial compensation for work done but do not have a real employment relationship. This applies to people who have received a fee, for example contractors, consultants, artists, board members and elected representatives. It also applies to people who have left and only received vacation pay during the year. (Kleer fetches the home address for the AGI form.)
- 99992: Employees who normally are not supposed to show up at any of the employer’s fixed reported workplaces to start their work. These can be people who are constantly at different workplaces, for example travelling salespeople, construction workers, travelling fitters, cleaners, property caretakers and security staff. (Fill in the workplace’s address in the employment contract in Kleer, and it is fetched for the AGI form.)
- 99993: Employees who are stationed and work abroad. (Fill in the workplace’s address in the employment contract in Kleer, and it is fetched for the AGI form.)
- 99994: Employees who have their own home as their workplace. (Kleer fetches the home address for the AGI form.)
- 99999: Employees who cannot be linked to a specific workplace and not to any of the numbers 99990-99994 either. Note: may only be used in exceptional cases. (Fill in the workplace’s address in the employment contract in Kleer, and it is fetched for the AGI form.)
If you have questions, contact your Kleer consultant.